Browser Wars on ORF.at
Edition November 2011
My methodology is outlined in detail in the first paragraphs of Browser Wars on ORF.at, Edition July 2011. Furthermore I decided to take versions out of the general browser distribution and examine those separately. This is mainly due to Mozilla’s present release-versioning which results in a new Firefox Version every 1-2 months.
The base of the presented Browser Distribution are PageImpressions on news.orf.at , sport.orf.at, iptv.orf.at and oesterreich.orf.at (including all region-specific subsites) from the 21th of November to the 28th of November 2011. In total I analyzed over 45.000.000 PageImpressions.
Browser Distribution in Total
Half of the PageImpressions are spawned by Microsoft Internet Explorer, the other half is dominated by Mozilla Firefox but also includes Apple Safari, Google Chrome and Opera. The details are as seen in Chart 1. Compared to July 2011 Microsoft Internet Explorer and Mozilla Firefox lose some usage to Apple Safari and Google Chrome.
In the timeline of a week we can see the usual drops in Microsoft Internet Explorer usage during Saturday and Sunday. It is significantly replaced by Mozilla Firefox and Apple Safari, other browsers show a stable usage pattern. See Chart 2.
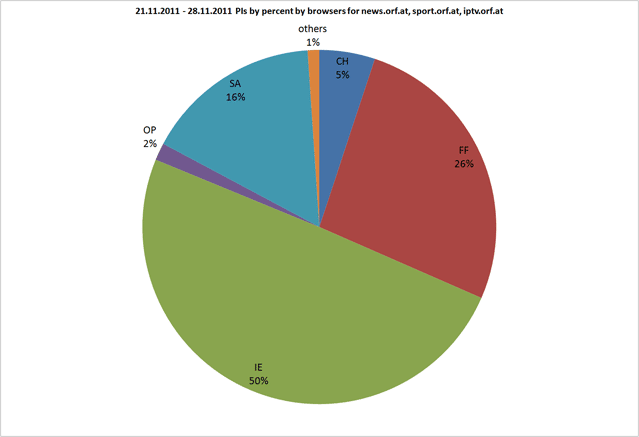 Chart 1: Browser Distribution in Total
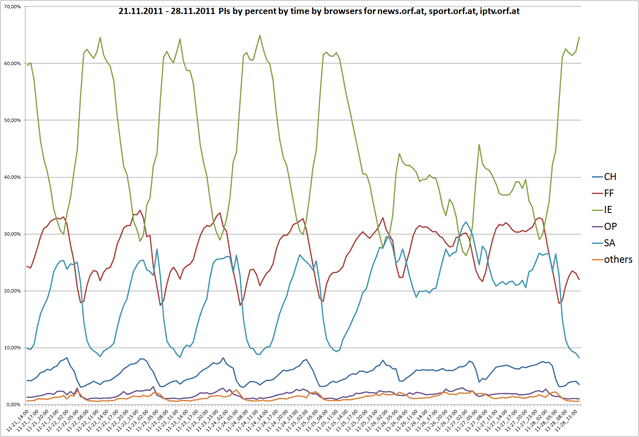 Chart 2: Browser Distribution Timeline
Mozilla Firefox Version Distribution
Chart 3 shows that Mozilla Firefox Version 8, which was the most recent Version in November 2011, has the biggest share. Notable is that Mozilla Firefox Version 3.x still accounts for 20% of all the Mozilla Firefox PIs although it was superseded 9 months ago by Version 4. Interpreting Chart 4 I conclude that Version 8 is gaining shares from Version 7 whereas Version 3 shares stay stable. Reduced Usage on Saturday and Sunday means that Version 3 is still used in Enterprise Networks.
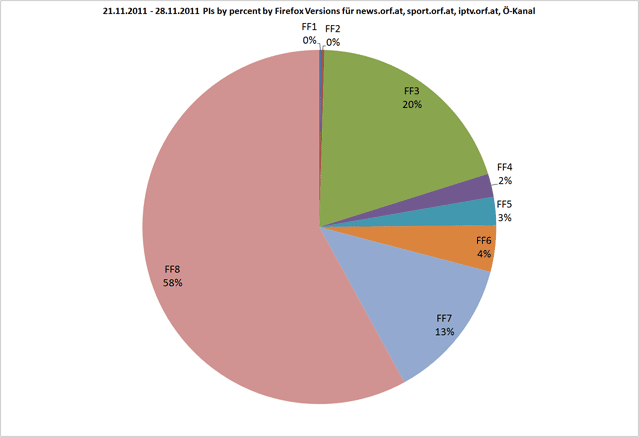 Chart 3: Mozilla Firefox Version Distribution in Total
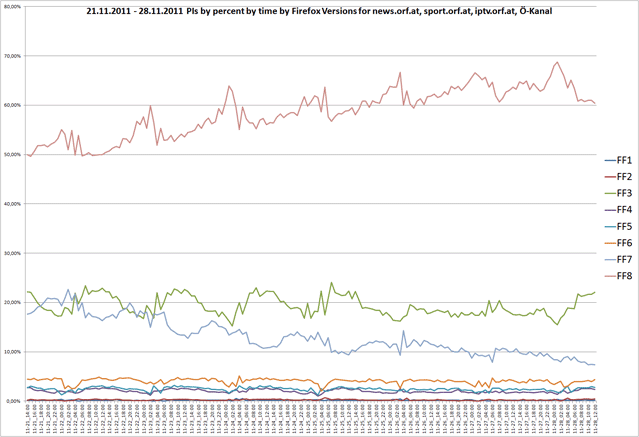 Chart 4: Mozilla Firefox Version Distribution Timeline
Microsoft Internet Explorer Version Distribution
This is not very surprising: Version 8 is still dominant probably due to it beeing the major Version on Microsoft Windows XP operating systems. This conclusion is supported by the share dropping on Saturday and Sunday in favor of Version 9. Many Enterprise Networks still need to upgrade Client PCs to Windows 7 which in turn is necessary to upgrade Microsoft Internet Explorer to Version 9.
Microsoft Internet Explorer 6 stalls at 4%, this accounts for 1,85% of the total browsers and is significantly less than the 3% measured in July 2011.
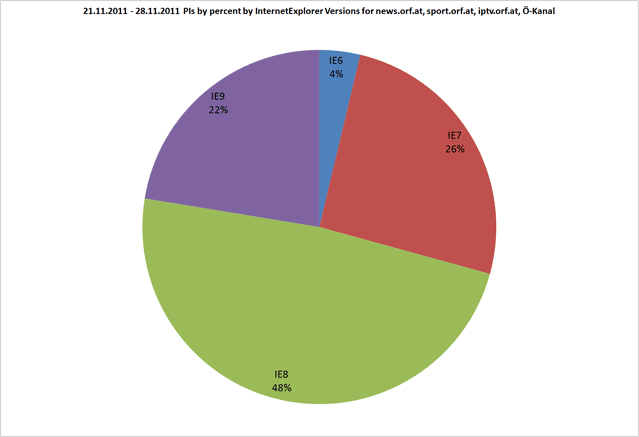 Chart 5: Microsoft Internet Explorer Version Distribution in Total
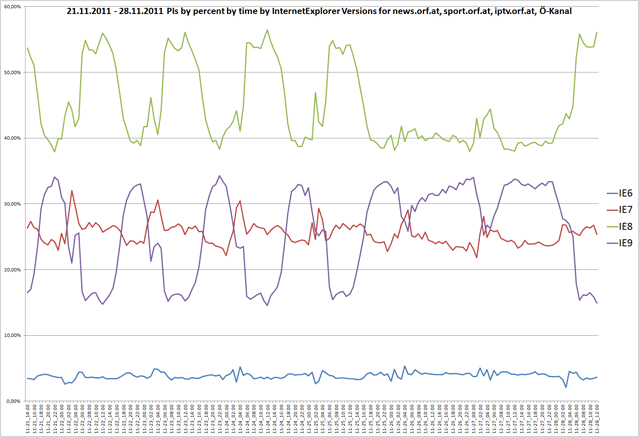 Chart 6: Microsoft Internet Explorer Version Distribution Timeline
Relevant Categories of Mobile Devices (in Austria)
Chart 7 shows that the listed Mobile Devices get a total share of 11% of all the PageImpressions. In the timeline „others“ is not shown to increase the details of the Devices timelines. Alas the increase in Android, Ipad and Iphone usage on Friday, Saturday and Sunday is accompanied by a decrease in „others“. The conclusion is that Mobile Devices are more heavily used during the weekend. Iphone and Ipad combined outsize Android which in turn is bigger than Symbian.
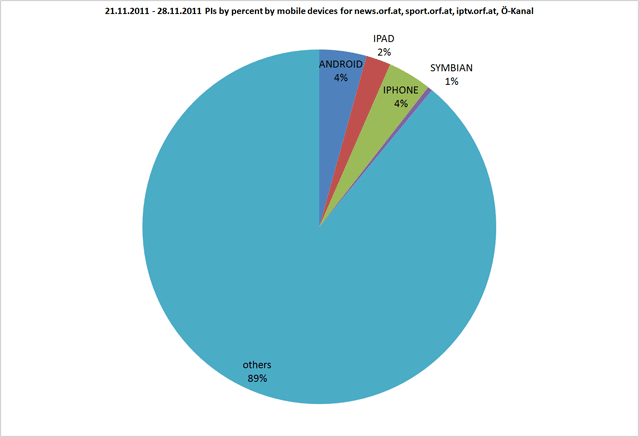 Chart 7: Mobile Device Distribution in Total
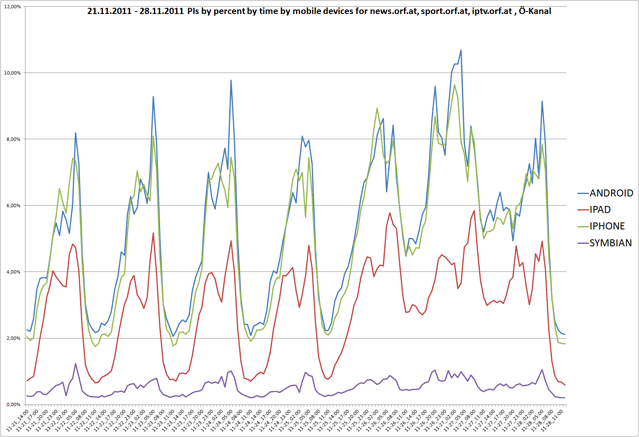 Chart 8: Mobile Device Distribution Timeline
Conclusions
The browser shares shifted slightly in favor of Apple Safari and Google Chrome when compared to July 2011. Nonetheless Microsoft Internet Explorer and Mozilla Firefox are the most widespread browsers in Austria. Timeline usage exhibits the usual differences between work-days and weekend-days. IE6 shares fell to 1,85% and Mobile Devices hold a significant share of 11% of the total PageImpressions.
Marius Lessiak,