Browser Wars on ORF.at
Edition July 2011
To begin with I want to line out the methodology I use for generating the figures. ORF.at is like any other austrian media company member of the ÖWA. This is an association of austrian internet companies that share their interest in creating objective web analytics. Much like Google Analytics but with a region specific approach. One of the core figures measured are PageImpression - whenever a User clicks on a website a PageImpression is registered (other methodologies often refer to this as PageClick or PageView).
The base of the presented Browser Distribution are PageImpressions on news.orf.at , sport.orf.at and iptv.orf.at from the 5th of July to the 12th of July 2011. The Browser related to each PageImpression is detected by inspecting the User-Agent property of the HTTP Request (that spawns the PageImpression). The time unit chosen for the report is one week due to different usage patterns we see between weekend-days and work-days (on our websites).
Browser Distribution in Total
Slightly more than half of the PageImpressions are spawned by Microsoft Internet Explorer, the other half is dominated by Mozilla Firefox but also includes Apple Safari, Google Chrome and Opera. The details are as seen in Chart 1:
- 25% Internet Explorer 8
- 17% Firefox 5
- 16% Internet Explorer 7
- 14% Safari (all versions)
- 8% Internet Explorer 9
- 7% Firefox 3
- 4% Chrome
- 3% Internet Explorer 6
- 3% Firefox 4
- 2% Opera
- 1% Gecko
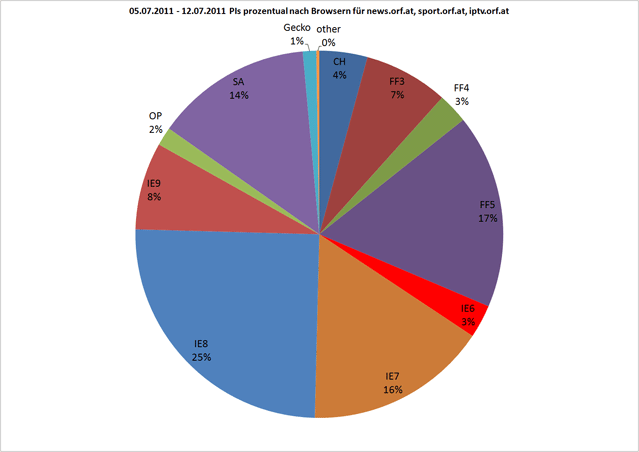 Chart 1: Browser Distribution in Total
So PageImpression-wise the Browser battle is still mainly between Microsoft and Mozilla. Safari has it’s share too but it is doubtful if it will get close to IE distribution in the next years. Besides that the low percentage of IE6 Users should be relaxing for most web developers spending working hours on legacy support. If you are wondering why IE6 is still active 10 years after release: There are companies that still have legacy web applications running only inside IE6 - so they keep it installed.
I’d like to point out that we see IE/FF Browser shares developing differently due to new versions: When a new version of FF is available via the auto-updater you can expect the shares of the new version to rise pretty soon (like FF5 in the present chart). A new version of IE gains shares much more slowly. We think this pattern is related to the prevalence of IE in enterprise networks. There the companies directly control when a new version is updated/installed on the clients and they take their time for decision making.
Browser Distribution Timeline
I already pointed out that we see different distribution patterns between work-days and weekend-days. Chart 2 visualizes the Browser distribution in percent over the course of the week (time unit 1 hour). The blue graph on top is IE8 and every spike happens at noon. The spikes are Tuesday, Wednesday, Thursday, Friday and then it just stops: Weekend happened and nobody is in the office. The spikes pick back up again after Sunday for Monday and Tuesday noon to complete the course of the week. This pattern is also true for the orange graph of the IE7 (in the middle at 16% average).
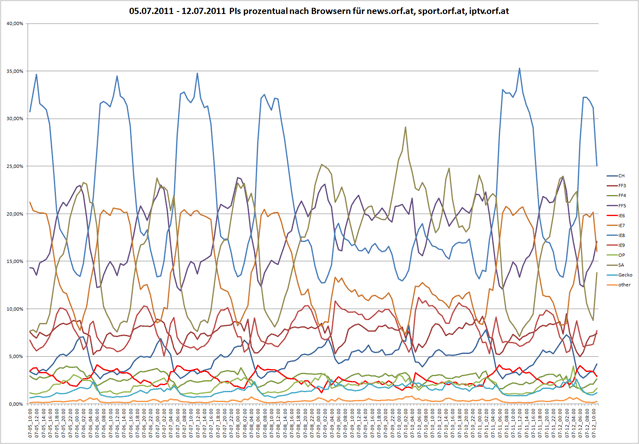 Chart 2: Browser Distribution Timeline
So on the weekend-days the browser distribution changes mainly in favour of Firefox and Safari, generally speaking in favour of any non IE browser. Again we think this is due to the prevalence of IE in enterprise networks. At home people like to use FF or own an apple computer with Safari. The graph pattern also reflects a plausible User behaviour regarding news consumption: On work-days it spikes in the morning and noon break at work. On weekend-days the spikes are more evenly distributed since Users consume information in a less time-structured way.
Conclusion
The analysis of the Browser distribution over the course of a week shows different patterns on work-days and weekend-days. Those are related to atwork/athome usage of the examined websites. IE6 shares fell to 3% which is nice but not enough to just drop any legacy support. Let’s take a look again in 4 Months.
Marius Lessiak,